Docksentry includes an optional, lightweight web dashboard. Enable it with WEB_UI=true.
environment:
  - WEB_UI=true
  - WEB_PASSWORD=your-secret    # optional, recommended
  - WEB_PORT=8080               # default
ports:
  - "9090:8080"
Access at http://your-server:9090 with the configured password (Basic Auth).
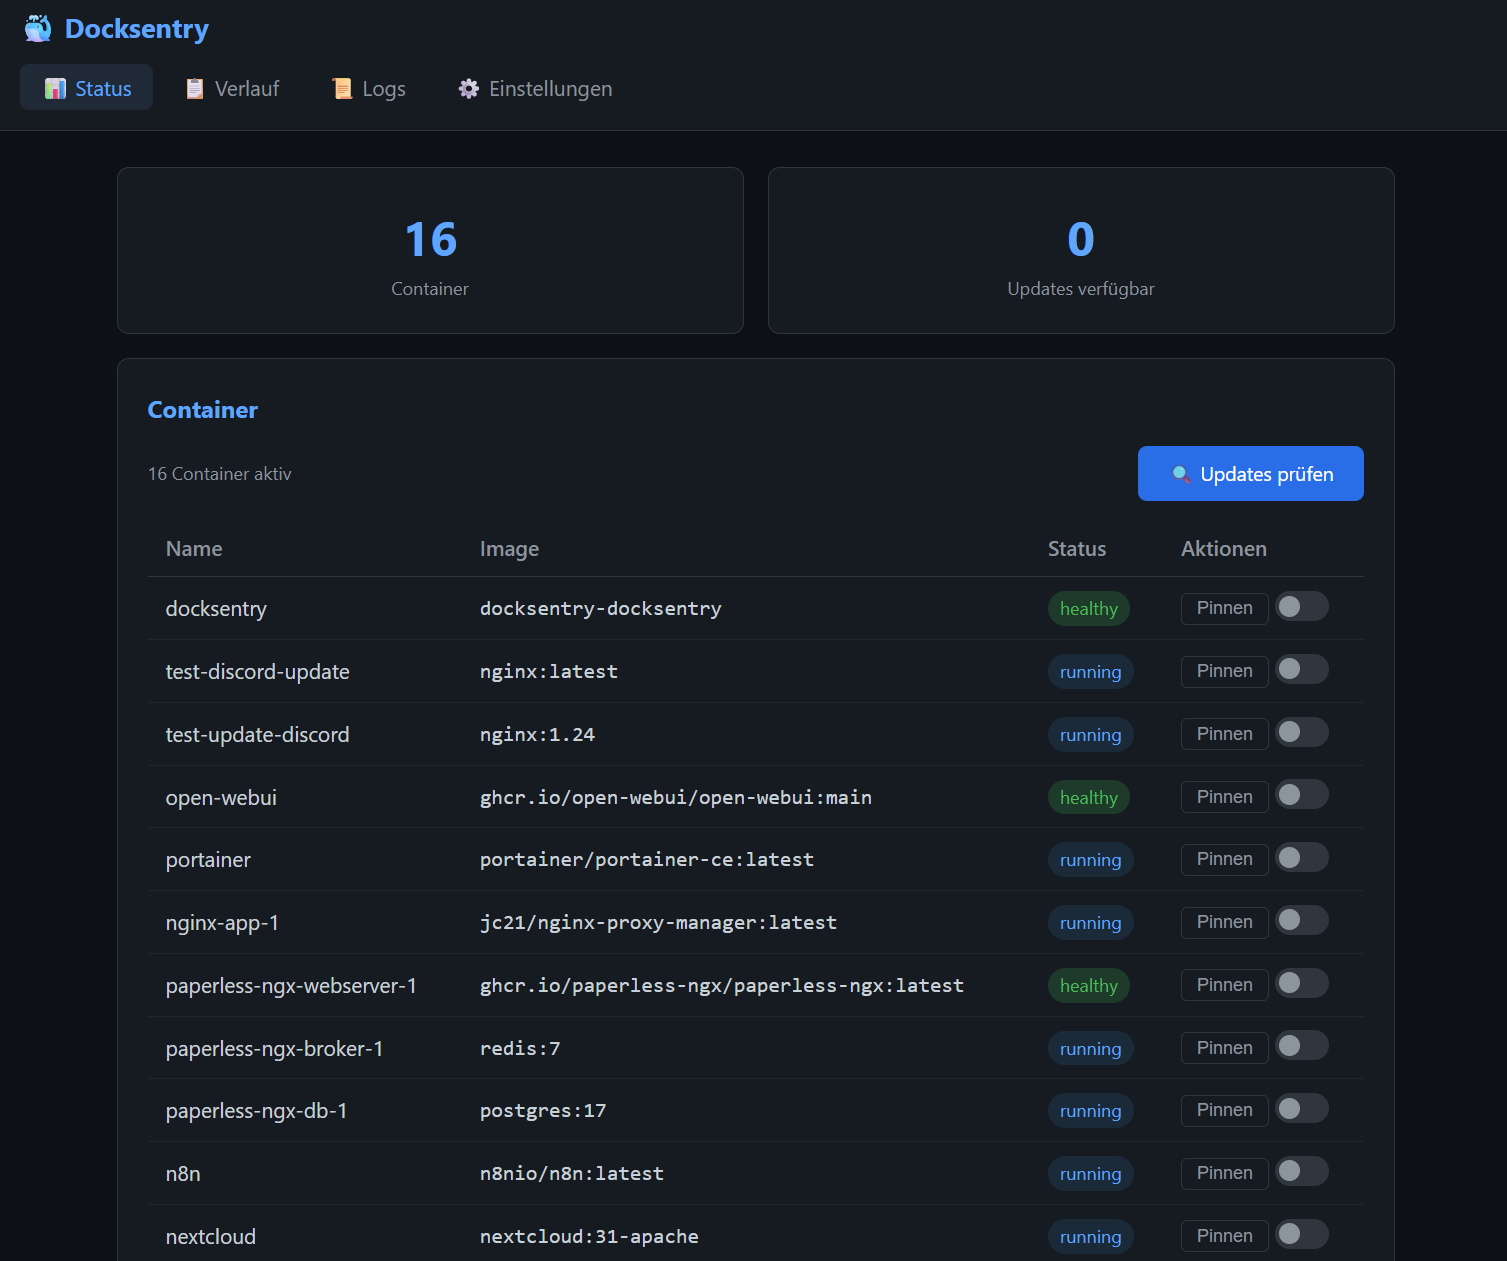
Live overview of all running containers with:
- Health badges (healthy / starting / running)
- Pending update badges
- Pinned container badges
- Auto-update toggle switches per container
- Pin/Unpin buttons per container
- Update buttons for containers with available updates
⚠ on/offtoggle to require confirmation for SemVer major bumps (per container)- "Check Updates" button to trigger a manual scan
- Bulk actions bar — multi-select containers via checkboxes, then apply one of: Update / Pin / Unpin / Auto-update on / Auto-update off in a single click
- Major-update banner — when a major bump is held back by
⚠ on, a yellow banner at the top lists pending containers with Confirm / Skip buttons
With DOCKER_HOSTS set, the table also gets a Host column, a host dropdown next to the search box that narrows the list to one host, and every button acts on the host of the row it sits on — updating nginx on the NAS never touches the local nginx. Deferred major bumps are listed per host too. A host that can't be reached shows up as a single line instead of taking the page down. The per-container detail page (click a container's name) is local-only, so remote rows aren't linked to it. Without DOCKER_HOSTS none of this renders and the page is exactly what it always was.
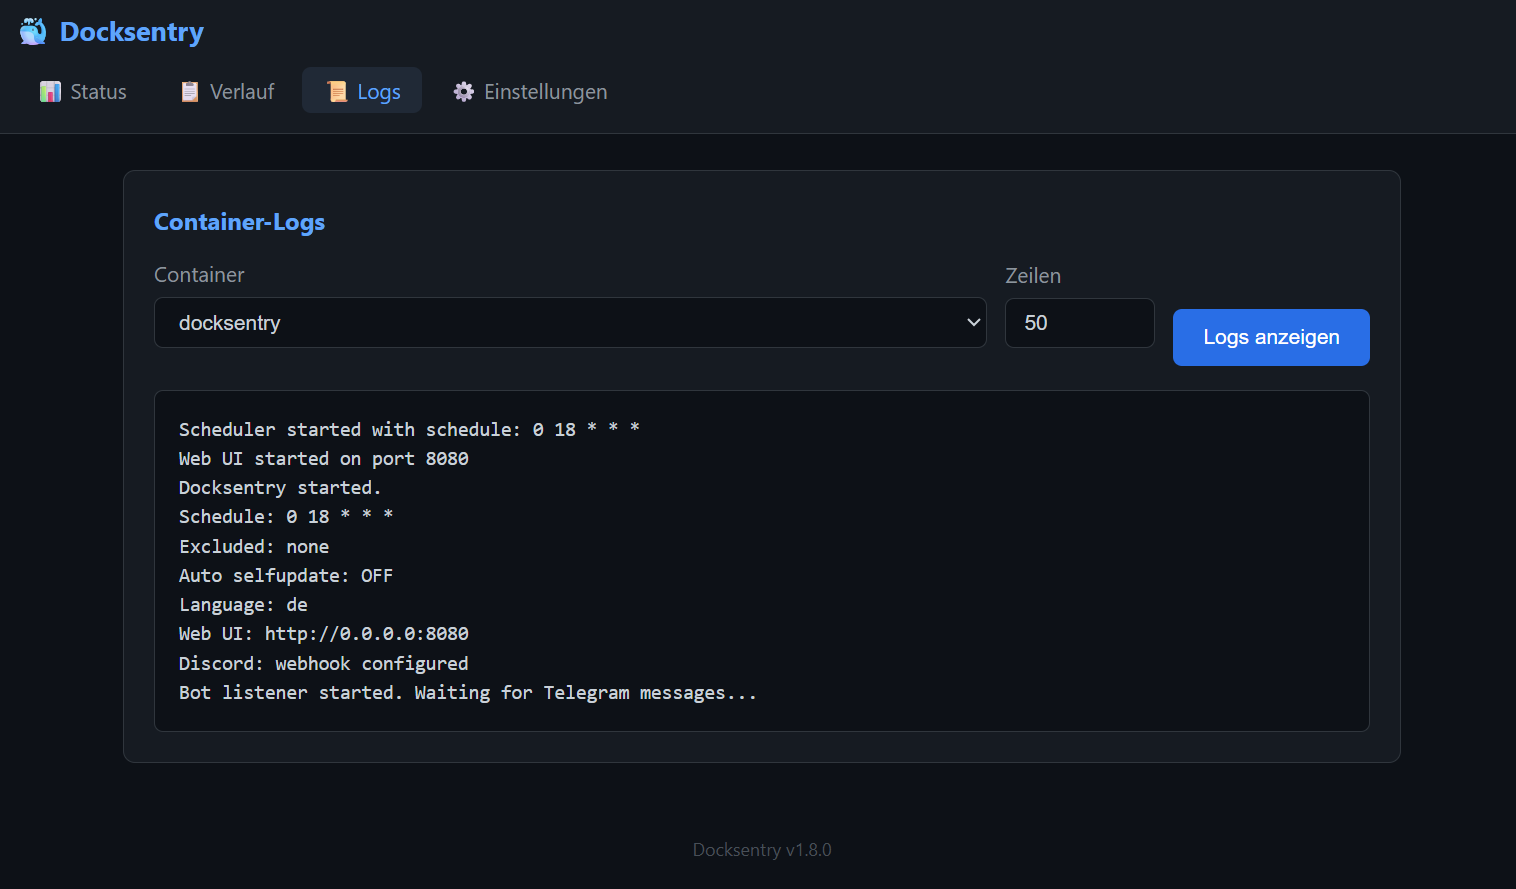
View container logs directly in the browser:
- Dropdown to select any running container
- Configurable number of lines (10-500)
Full update log showing:
- Timestamp
- Container name
- Success/failure status
- Detail message
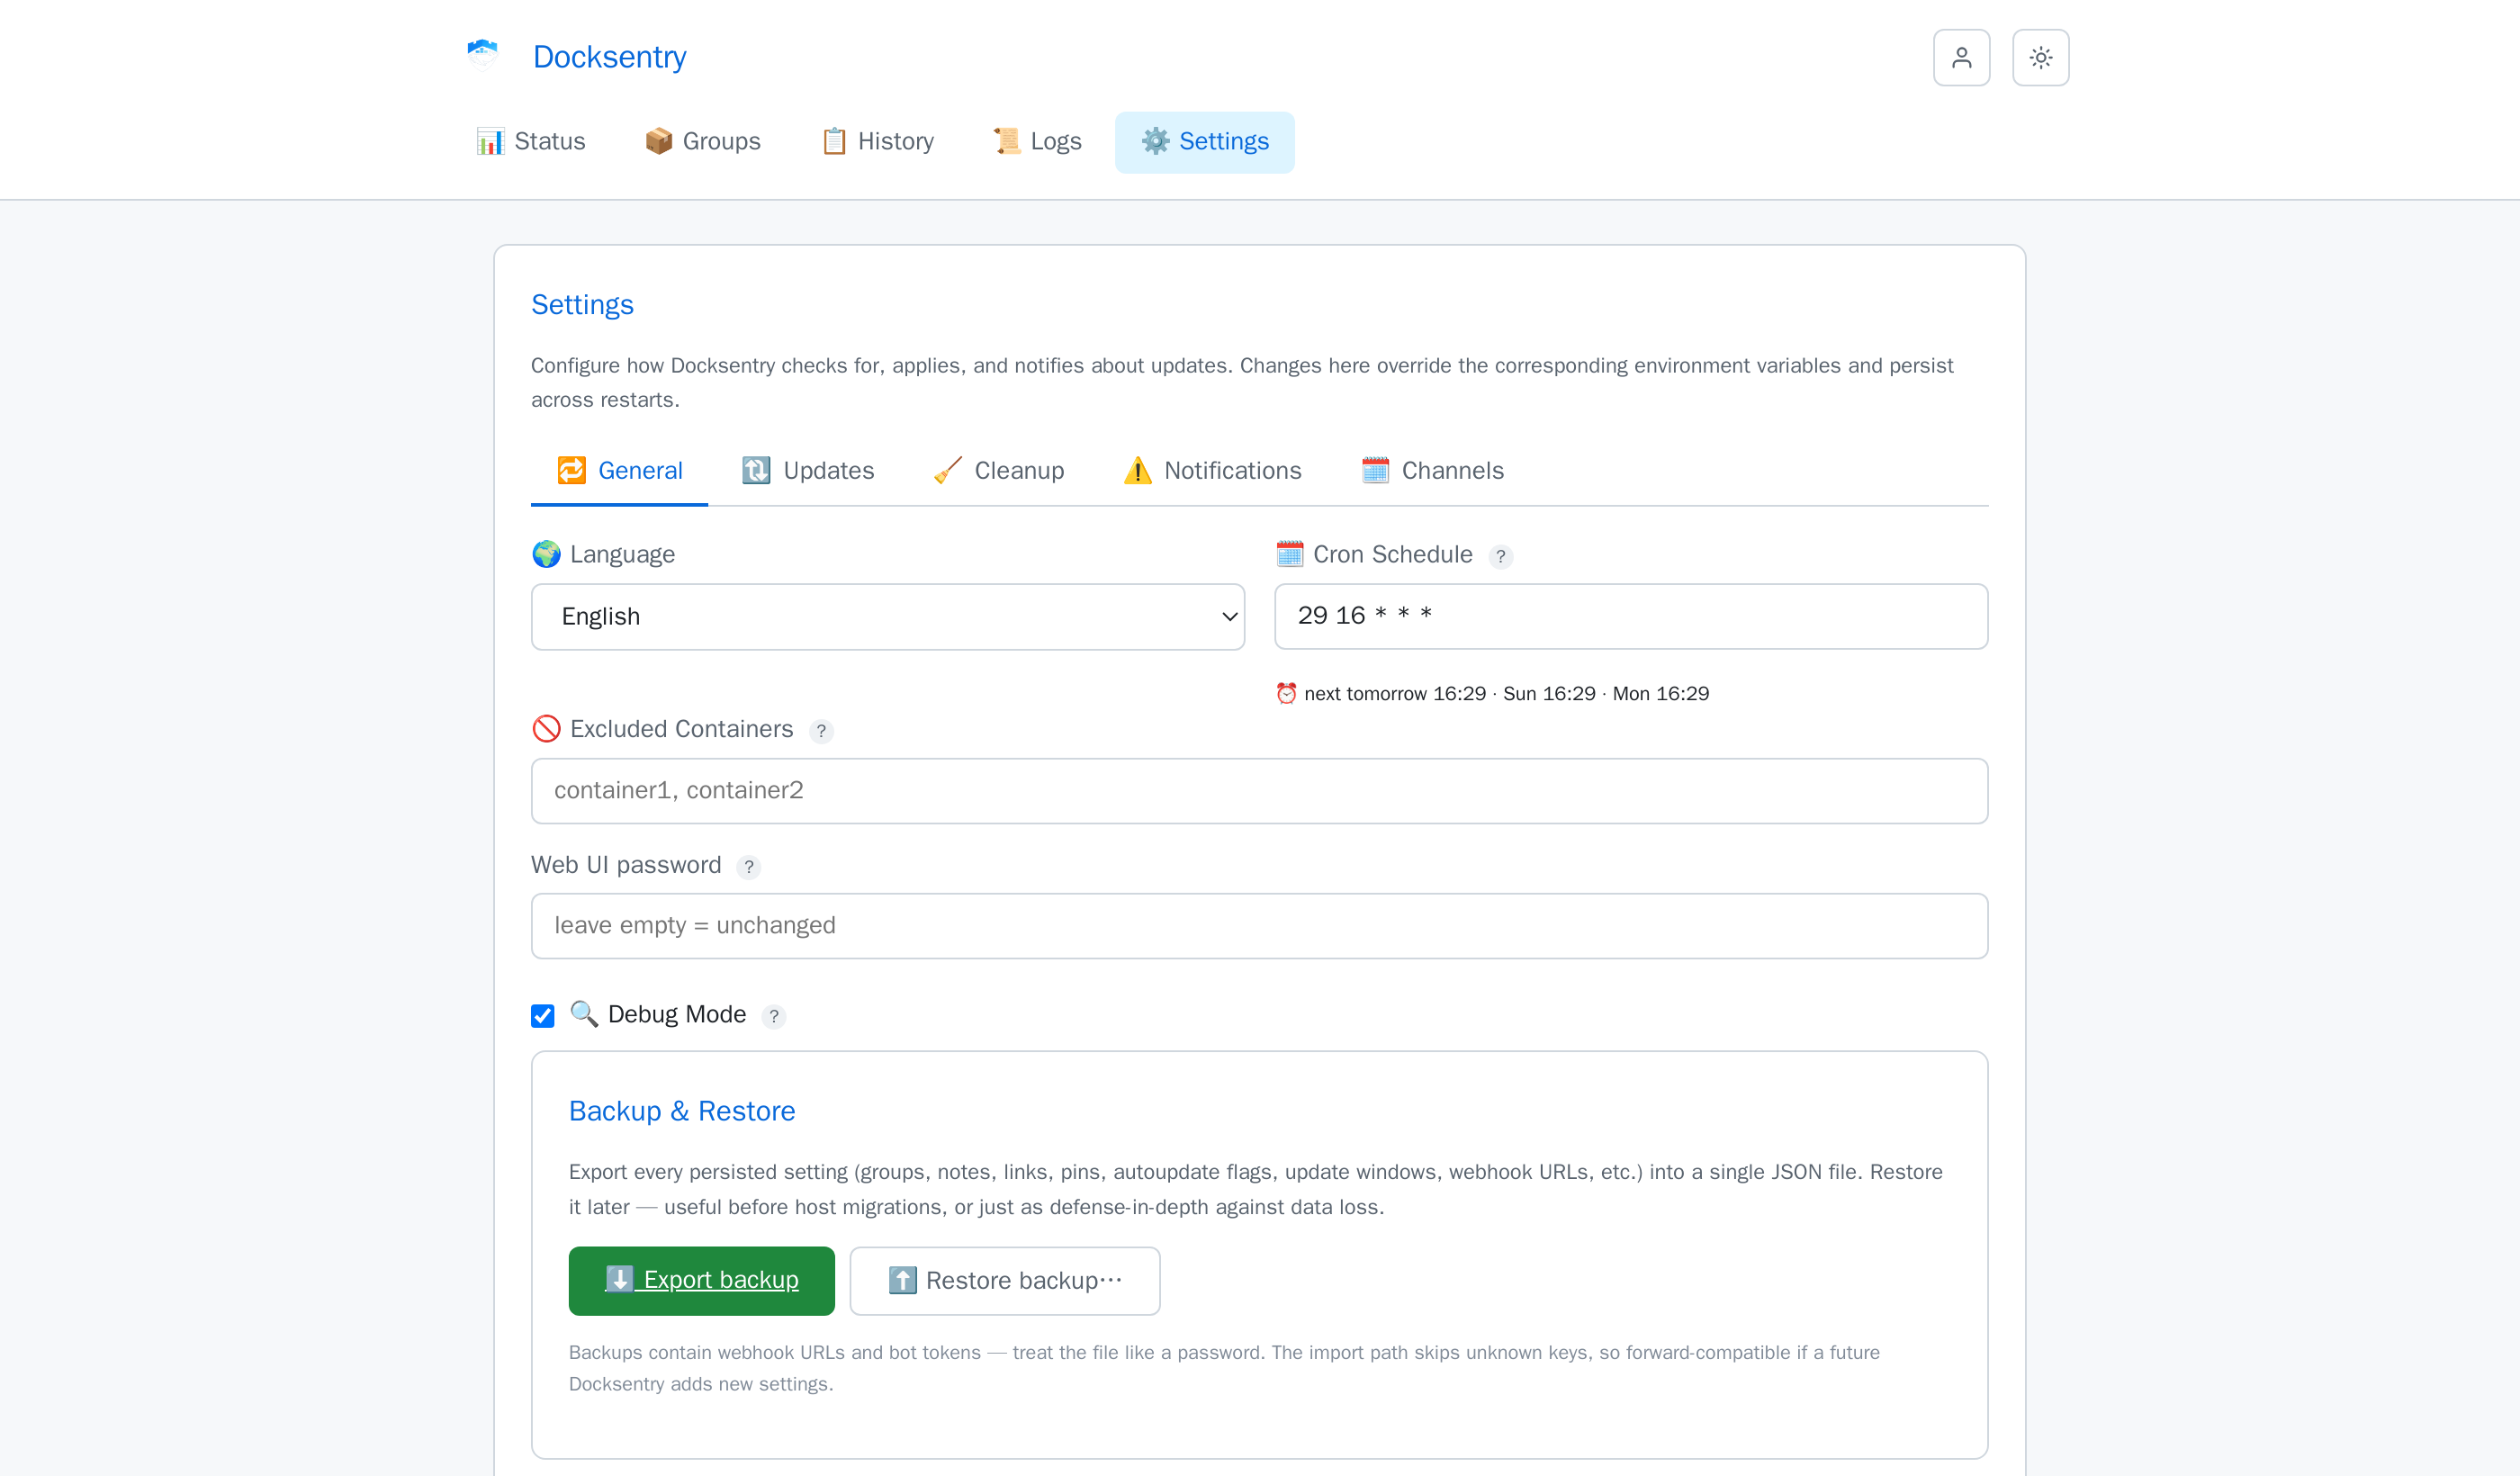
The Settings page is grouped into five tabs:
| Tab | Contents |
|---|---|
| General | Language, cron schedule, excluded containers, debug mode |
| Updates | Auto self-update toggle, hint about per-container settings on the Status page |
| Cleanup | Auto cleanup, grace hours, backup retention, local-only-images backup |
| Notifications | Disk warning threshold + auto-cleanup-on-warning, quiet hours start/end |
| Channels | Telegram topic ID, Discord webhook, generic webhook |
Plus two cards always visible below the tabs:
- Update Windows (per-container HH:MM ranges + weekdays)
- Maintenance (one-shot Image Cleanup / Self-Update buttons, both with confirmation dialogs)
- Info (version, Telegram status, masked credentials)
Hover a ? icon next to any setting label for an inline explanation. Save feedback appears as a brief toast at the top-right.
All settings persist across restarts (saved to /data/settings.json).
| Setting | Editable in Web UI |
|---|---|
| Language | Yes |
| Cron Schedule | Yes |
| Debug Mode | Yes |
| Auto Self-Update | Yes |
| Auto Cleanup + grace hours + backup-local-only + backup retention | Yes |
| Disk warning threshold + auto-cleanup-on-warning | Yes |
| Quiet hours (HH:MM start/end) | Yes |
| Update Windows per container (HH:MM range + weekdays) | Yes (own section) |
| Exclude Containers | Yes |
| Telegram Topic ID | Yes |
| Discord Webhook | Yes |
| Webhook URL | Yes |
| Bot Token | No (ENV only, masked) |
| Chat ID | No (ENV only, masked) |
WEB_PORT, WEB_PASSWORD |
No (ENV only — would lock you out) |
The Update Windows section lets you pick a container, set a HH:MM–HH:MM range, and tick which weekdays the window applies to. Containers without an entry update without restriction.
The Maintenance section provides one-click buttons for Image Cleanup and Self-Update — same actions as Telegram /cleanup and /selfupdate, available headlessly.
Two read-only endpoints, guarded by API_TOKENS (see
security.md):
GET /metrics— Prometheus text format. Reports containers watched, updates pending, one gauge per host, and one per container that has an update — so an alert can name the thing that needs attention rather than only a count.GET /api/status— the same numbers as JSON.
Both read what the status page reads. Neither triggers a check: an endpoint that did would let anyone with a scrape interval drive the update loop.
Below 700px the container table is replaced by one card per container — same data, laid out to fit a screen you hold in one hand, with the actions sized for a finger. Above that width the table returns. Both are built from the same values, so they cannot disagree about a container's state.
- Password protection via Basic Auth (
WEB_PASSWORD) - Password hashed with SHA-256, never stored in plain text
- Sensitive values (Bot Token, Chat ID) are masked in the UI
- For HTTPS, use a reverse proxy — see Security